Selling more doesn’t always mean making more money.
Learning to analyze sales data with AI isn’t just about generating charts. It’s about noticing when the numbers tell a different story from what your sales team expects.
That sounds obvious until you’re running a small business, orders are coming in, and everyone is busy keeping customers happy. Sales volume is up. The team is shipping more products. The monthly revenue report looks reasonably healthy.
So why does the business seem to have less room to breathe?
Sometimes the answer is hiding in a spreadsheet.
For this BetterBizLab test, we created three months of synthetic sales records for a small consumer products business and asked Claude to analyze the data. We wanted to see whether AI could do more than summarize revenue. Could it identify a problem worth investigating? Could it distinguish a real financial warning from a guess? And could a business owner use the results without blindly trusting the software?
The most interesting finding wasn’t a complicated forecast.
It was that the company sold more units every month while its gross profit deteriorated.
Here’s what the test showed, how you can run a similar analysis, and where human judgment still matters.
The Sales Problem We Wanted AI to Investigate
Imagine a 12-person business selling skincare and personal care products through online and retail channels.
The business has six products. Every month, someone exports sales information into a spreadsheet. The file includes quantities sold, returns, selling prices, discounts, and estimated product costs.
Nothing particularly sophisticated.
That’s the point.
Many small businesses already have the information they need to spot important trends. The challenge is finding time to examine it—and knowing which questions to ask.
A monthly sales report might tell the owner that revenue increased. It might not immediately explain whether that increase came from more profitable orders, heavier discounts, or products that generate relatively little gross profit.
We wanted to test whether AI could connect those dots.
What was in our test file?
We built a synthetic CSV containing 36 sales records across July, August, and September 2026.
The records covered six products and two sales channels: online and retail.
Each row included the basic information needed to calculate:
- Units sold and returned
- Net units retained by customers
- Gross sales at list price
- Discounts
- Net sales
- Estimated cost of goods sold
- Estimated gross profit and gross margin
We deliberately kept the dataset small enough to audit manually.
Important: This was a controlled test using fictional business data, not confidential records from a real company. The results demonstrate an analytical workflow; they do not establish how AI would perform on every business’s data.
We also included precomputed financial columns, allowing us to check whether the AI accepted those numbers without question or independently recalculated them.
What We Asked Claude to Do
We uploaded the CSV and asked Claude to analyze the business’s financial performance.
The instructions were straightforward: recalculate the numbers from the source columns, examine monthly revenue and gross profit, identify product-level risks, and recommend three management questions worth investigating.
We also explicitly told it not to invent business policies, explanations, or costs that weren’t in the file.
That last instruction matters.
If sales decline, an AI assistant might suggest that competition increased or customer demand weakened. Those explanations could be plausible, but a basic sales spreadsheet cannot prove them.
We wanted the analysis to distinguish what the data actually showed from what a manager would need to investigate.
The First Finding: Sales Volume Grew, but Profit Didn’t
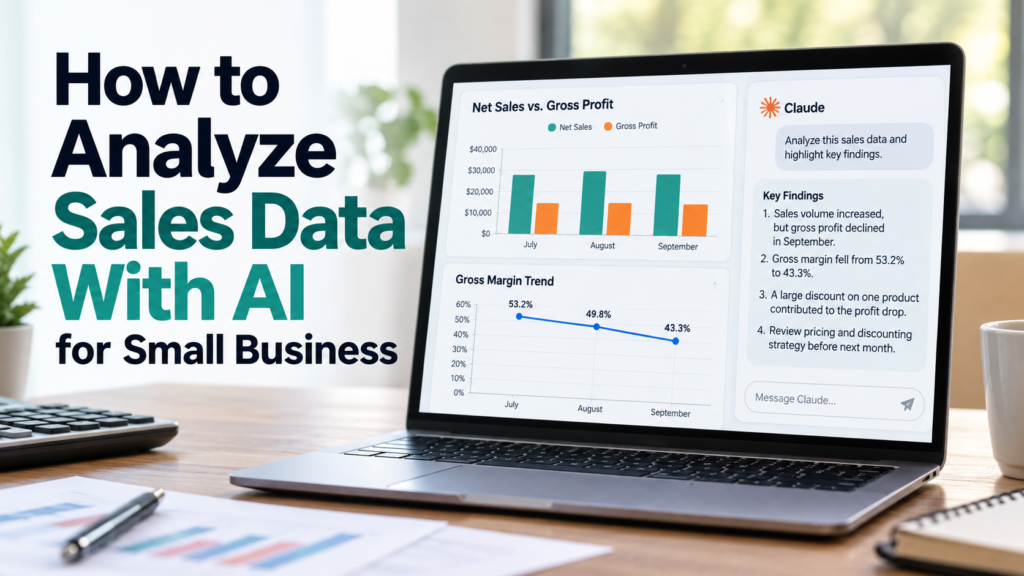
Here’s the monthly picture Claude produced.
| Metric | July | August | September |
|---|---|---|---|
| Units sold | 1,292 | 1,476 | 1,627 |
| Net sales | $25,746.00 | $28,142.93 | $27,482.85 |
| Gross profit | $13,696.60 | $14,013.18 | $11,906.85 |
| Gross margin | 53.2% | 49.8% | 43.3% |
| Unit return rate | 2.01% | 3.05% | 4.55% |
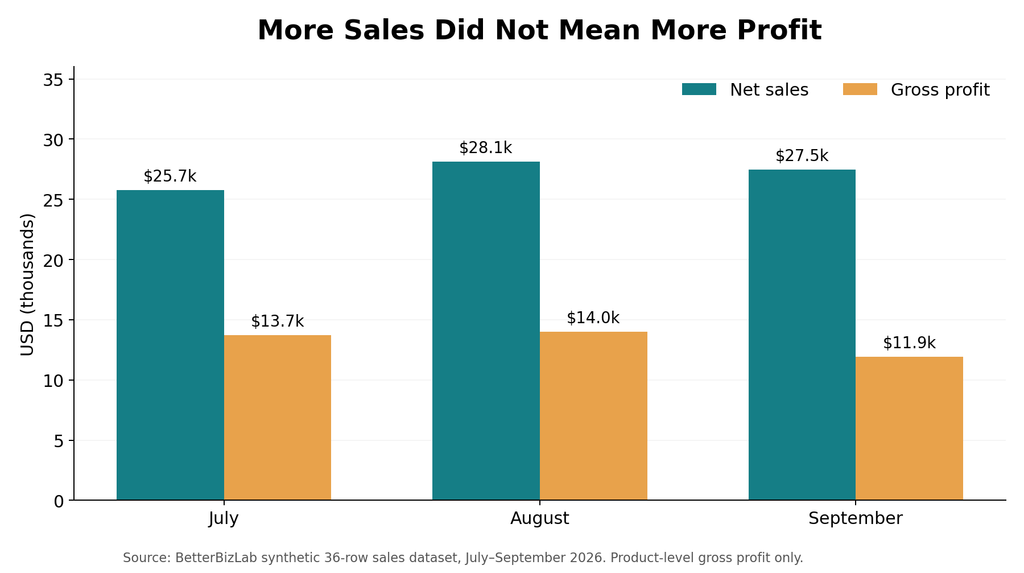
Look at the first and fourth rows.
The company sold approximately 26% more units in September than in July.
Yet its gross margin fell from 53.2% to 43.3%.
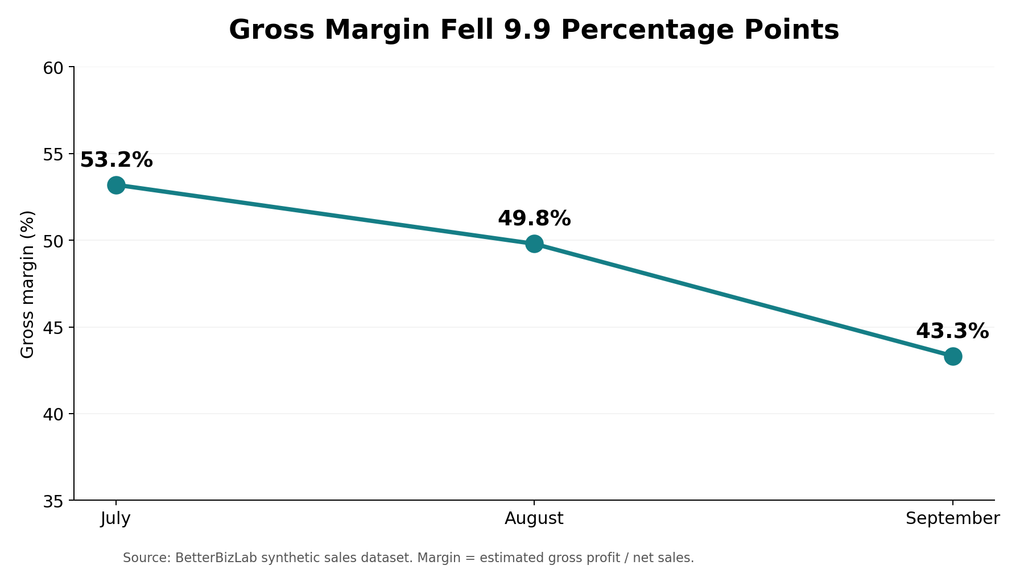
And between August and September, gross profit dropped approximately 15%.
A business owner looking primarily at order volume could easily miss that change.
The September revenue figure wasn’t dramatically lower than August’s. But the economics behind those sales had changed.
That is exactly the kind of problem an AI-assisted spreadsheet review should help uncover.
Not because the calculation is impossible in Excel. It isn’t.
The value is in bringing several related signals together and making the problem easier to investigate.
Why Did Gross Profit Fall?
Claude identified two major contributors: heavier discounting and higher estimated unit costs.
The discount figures were especially striking.
| Month | Discounts | Discounts as % of kept-unit list value |
|---|---|---|
| July | $800.00 | 3.0% |
| August | $2,047.07 | 6.8% |
| September | $4,914.15 | 15.2% |
Discounts increased substantially over the quarter.
To explore their financial impact, Claude calculated what September gross profit would have been if the business had sold the same September quantities but used July’s discount rates and unit costs.
Under those hypothetical conditions, September gross profit would have been $16,711.75 rather than $11,906.85.
The difference was $4,804.90.
Claude attributed $3,926.10 of that hypothetical difference to higher discounts and $878.80 to higher unit costs.
We independently checked those calculations against the synthetic dataset.
The arithmetic matched.
But here’s the distinction a business owner needs to understand: this was a scenario calculation, not proof that discounts caused a particular percentage of the actual month-over-month profit decline.
Customers might have purchased fewer units without those promotions. The spreadsheet doesn’t tell us.
A useful AI analysis should help management ask better questions—not turn a hypothetical scenario into a guaranteed business outcome.
The Product That Deserved a Closer Look
The most actionable part of Claude’s report concerned one product: the Gift Set.
In September, the Gift Set had a 30% discount in both sales channels.
Its unit return rate reached approximately 12.2%, and its gross margin fell to about 18%.
Its September gross profit was only $519.44, compared with $1,540.76 in August.
That doesn’t automatically mean the product was a failure.
Maybe the company was clearing inventory. Maybe the promotion attracted new customers. Maybe the Gift Set was designed to drive sales of other products.
We don’t know.
But we do know enough to ask some specific questions.
Why was the discount set at 30%? Was the promotion evaluated on gross profit or only on sales volume? Why were 12 of the 98 units sold returned? Were those returns damaged, resalable, or associated with a fulfillment problem?
Claude also calculated that, at a lower hypothetical discount pattern and the same September retained-unit volume, Gift Set gross profit would have been $1,205.84.
Again, that’s a scenario, not a forecast.
Still, it’s a useful starting point for a management discussion.
Instead of saying, “Our promotions aren’t working,” the business can ask, “What did we gain from this specific promotion, and was it worth the margin we gave up?”
That’s a much better question.
Another Product Told a Different Story
The Hydrating Serum showed a separate warning sign.
Its September unit sales were essentially flat compared with August, even though discounting became more aggressive.
Its net sales declined approximately 8.3%, while gross profit fell around 17.3%.
That doesn’t prove the discounts were ineffective.
We would need information about customer demand, promotional timing, competitors, and other factors to make that judgment.
But it gives the team a reason to examine whether the discount strategy was delivering the intended result.
This is one reason I wouldn’t ask AI to simply identify the “best” and “worst” products.
A product with a lower margin might be strategically valuable. Another with healthy revenue might be tying up cash or generating costly returns.
The better question is: Which products show changes that deserve management attention?
What Claude Got Right—and What Still Needed Human Review
For this test, Claude did several things well.
It independently recalculated the financial columns, organized the monthly results, identified the weakening margin trend, and connected the Gift Set’s discounting with its deteriorating product economics.
It also distinguished observed facts from possible explanations.
That made the report more useful than a generic sales summary.
But the analysis had limitations.
1. Gross profit was not net profit
Our dataset calculated product-level gross profit from net sales and estimated cost of goods sold.
It did not include advertising, shipping, payment processing, payroll, storage, or other operating expenses.
So a product showing positive gross profit might still be unprofitable after those additional costs.
2. Returned products were treated simply
The dataset assigned cost of goods sold to units kept by customers.
That effectively assumes returned units don’t create additional product losses in the calculation.
Real businesses may incur inspection, repackaging, disposal, freight, or replacement costs.
For a product with a high return rate, this omission could materially affect the decision.
3. The unit costs were estimates
Estimated unit costs increased in a remarkably consistent pattern across products.
That makes sense for a constructed test file.
It would be more suspicious in a real business export, where costs may change differently by supplier, shipment, or product.
Before acting on the analysis, a manager should compare estimated costs with purchase orders, supplier invoices, or landed-cost records.
4. The data couldn’t explain customer behavior
We could see sales quantities and discounts.
We couldn’t see customer acquisition costs, promotion objectives, competitor activity, repeat purchases, or reasons for returns.
Without that context, an AI assistant can identify patterns but cannot reliably explain every cause.
These limitations aren’t reasons to avoid AI.
They’re reasons to design a review process around it.
How to Analyze Your Own Sales Data With AI
You don’t need a complicated analytics platform to try this.
Start with a clean CSV or Excel export from your POS, ecommerce platform, accounting system, or order management software.
For an initial review, aim to include the following fields where available:
- Date or reporting period
- Product name or SKU
- Sales channel
- Units sold
- Units returned
- Unit selling price
- Discount amount or rate
- Actual or estimated unit cost
If the data contains customer names, addresses, payment information, or other sensitive details, remove unnecessary information before uploading it. Review your company’s data-handling rules and the AI provider’s current privacy and retention settings.
You should also confirm that quantities, returns, discounts, and costs are defined consistently.
For example, one system may report revenue after refunds while another reports it before refunds.
If the definitions don’t match, even perfectly executed calculations can produce misleading comparisons.
A prompt you can reuse
Copy this into your AI assistant after uploading the file:
Sales Analysis Prompt
Analyze the attached sales data for a small business.
First, inspect the columns and explain any assumptions needed to interpret them.
Independently calculate monthly net sales, units sold, units returned, gross profit, and gross margin wherever the necessary data is available.
Identify meaningful changes in sales volume, discounts, returns, and product-level profitability.
Rank the three issues that deserve management attention, based on the available evidence.
For each issue, separate:
- What the data confirms
- What might explain it but remains unverified
- What additional information a manager should check
Show the calculations behind important findings.
Do not invent missing costs, customer behavior, business policies, or causal explanations.
Do not recommend changing prices, discontinuing products, or making financial commitments without human review.
Notice that the prompt doesn’t ask for a beautiful dashboard first.
It asks for an audit and a decision-oriented explanation.
You can always request charts afterward.
A Simple 15-Minute Weekly Sales Review
For a small team, the simplest starting point is a 15-minute weekly review. You don’t need a complicated dashboard or a fully automated system.
First five minutes: verify the data.
Export the latest sales report. Check the reporting dates, missing records, returns, and any unusual totals.
Next five minutes: ask AI to identify changes.
Compare the current period with the previous period. Ask about revenue, gross margin, discounting, returns, and products with unusual movement.
Final five minutes: decide what needs investigation.
Choose one or two questions that actually matter.
Maybe the sales manager needs to explain a large discount. Maybe purchasing needs to confirm a cost increase. Maybe customer service should review return reasons.
Assign the follow-up to a person.
That final step is important. An AI-generated insight is only useful if someone can turn it into an informed business decision.
And if the source data is incomplete, the right decision may simply be to investigate before taking action.
Should You Use ChatGPT, Claude, or Excel?
For a small business, I wouldn’t choose a tool based solely on which one produces the most impressive-looking explanation.
I’d focus on the workflow.
Excel or Google Sheets remains useful for transparent formulas, repeatable calculations, and maintaining the source data.
ChatGPT offers file-based data analysis and visualization capabilities that can help users explore spreadsheets and ask follow-up questions.
Claude can also analyze uploaded files and explain patterns in business data. In our controlled test, it produced a detailed financial analysis with calculations we were able to verify.
We did not complete a controlled head-to-head evaluation of both assistants for this article, so this test doesn’t establish that one is more accurate than the other.
Whichever tool you choose, keep the original spreadsheet and independently check material financial conclusions.
For recurring reports, a validated spreadsheet model or business intelligence dashboard may be more reliable than asking a chatbot to rebuild every calculation from scratch each week.
If you’re considering automating other parts of your business, our guide to the best AI automation tools for small business explains where different tools fit—and where manual oversight still matters.
AI is most useful here as an analytical assistant, not as the accounting system of record.
What I Would Not Let AI Decide
The same principle applies to accounts payable. In our AI invoice processing test, we looked at how AI handles invoice calculations, missing information, and decisions that still require human approval.
I would not let an AI assistant automatically lower prices, cancel a product, approve a promotion, or change purchasing commitments based on a single spreadsheet analysis.
Those decisions involve context that may not be present in the file.
A low-margin product could bring in valuable repeat customers. A promotion might have a strategic purpose. A spike in returns could reflect a temporary fulfillment issue rather than a product defect.
AI can flag those situations.
Management still needs to investigate them.
A useful operating rule is simple:
Let AI identify the question. Let verified business data and accountable people determine the action.
Final Takeaway
The biggest lesson from our test wasn’t that AI can calculate gross margin.
A spreadsheet can do that.
It was that a relatively small dataset contained a meaningful business warning: unit sales were rising, but discounting, estimated costs, and returns were putting pressure on gross profit.
Claude surfaced that pattern, identified a specific product worth investigating, and produced calculations that matched our independent checks.
It also had access to only part of the business picture.
For a small business owner, that’s the right way to think about AI sales analysis.
Not as an automatic decision-maker. Not as a replacement for accounting. And not as a tool that somehow knows why customers behave the way they do.
Use it to notice patterns sooner, question assumptions, and focus your team’s attention on the decisions that deserve a closer look.
Because sometimes the most important thing in your sales report isn’t how much more you sold.
It’s how much less you kept.